TradingKey - Lennar began trading on September 11 with comments indicating a confirmed closing price on September 10 of $77.90. This represented a 3.54% change, and was effectively a reference to $77.92. Lennar’s stock made a technical break to the downside, and fell below its trendline and $79.97 support level as mortgage rates moved up towards a range of 6.5%-7%. This reflects more than a pure price movement. Improving execution at the company level is being offset by a more challenging macro environment in the housing market. Lennar, along with the other housing constructors, will have higher earnings on September 16.
Mortgage Rates Are the Main Near-Term Headwind
Mortgage rates are currently the biggest concern for Lennar. The 30-year mortgage rate is back in the high 6% range, averaging 6.76% as of September 10. The combination of higher Treasury yields and inflation has the potential to push mortgage rates and monthly payments higher while weighing on demand.
This timing is particularly difficult for Lennar because the company had already adopted a heavy incentive policy to retain sales volumes. If mortgage rates elevate in the fall, the company’s management will be forced to increase rate buydowns and other incentives, making the margin recovery even more challenging.
Q3 Earnings Are the Immediate Catalyst
Lennar will release fiscal Q3 earnings after the close on September 16, with their earnings call scheduled for September 17 at 11:00 a.m. ET. It is probable that analysts will not focus on EPS for this report, but will instead pay attention to new orders, gross margins, the level of incentives, and the delivery target for the full year.
The existing Q3 guidance frame from management indicates the company will likely achieve between 21,000-22,000 new orders, 20,500-21,500 deliveries, a selling price of $375,000-$380,000, and a general home-sale gross margin of roughly 16%.
Results that are even slightly above these levels, occurring as incentives continue to drop, would show that the margin trough is behind the company. A renewed increase in incentives or a further reduction in full-year deliveries would be much more bearish signals.
Q2 Showed Early Signs of Margin Stabilization
The company’s most recently reported quarter showed weakening results compared to the year before, but improvements compared to the previous quarter. Revenues of $7.94 billion were reported in Q2 of 2026, with GAAP EPS of $1.24 and a 2% rise in deliveries to 20,519 units, along with a 4% decline in new orders to 21,749.
The home sale gross margin improved to 15.6% from 15.2% in Q1. This is well below previous cycle levels, but the slight sequential improvement is a positive sign with regard to the margin trough.
The trough of the current margin cycle may be positive, but the question is how the current rate shock renewal will affect this improvement in margin.
Incentives Are the Number to Watch
Lennar’s incentives came in Q2 at 12.9% compared to 14.5% in Q4 of last year. Management said this was the first real and potentially sustainable decline after roughly three years of generally rising incentives. These incentives make for a small earnings beat, but the incentive rate management expects to normalize to 4 – 6 % would still make for a long way to go.
An extended incentive rate would likely increase the rate orders remain constant. This may lead to a more meaningful recovery of gross margins. An increase in incentives to around 14 – 15% may keep the recovery of the incentive rate thesis where it stands today.
Construction Costs and Cycle Times Are Improving
Operationally, Lennar is becoming increasingly efficient. Construction costs fell by another 2%, and at the end of the second quarter, construction costs were 13% less than they were a few years ago. Cycle times fell to a new low of 121 days.
These improvements help offset financing incentives and group pricing pressure, because they help offset the costs of building affordable housing.
Based on these changes, I would say the Lennar business model is not broken. The operating model continues to become more efficient while the market continues to become more challenging.
Asset-Light Model Strengthens the Balance Sheet
Lennar has changed their risk outlook with substantial improvement. Only approximately 2% of homesites are owned on the balance sheet, while about 98% are controlled through third parties.
This lessens capital intensity and risk of land-impairment. By the end of Q2, Lennar had $1.8 billion in cash for homebuilding and had no borrowings on their $3.1 billion revolver with homebuilding debt to capital ratio of 15.8%.
This strong balance sheet will aid Lennar during a housing downturn because they won't have to shield an overleveraged land bank.
Buybacks Add Another Layer of Support
Lennar spent $447 million to buy 5 million shares in Q2, at an average of $89.35 per share. With the stock at $77.90 now, shares are down 13% from the buying price last quarter.
The share count has decreased by 6% over the last year. A dividend cost of $0.50 is paid out quarterly.
Even though supportive factors are in place, the expected decline in earning is caused by anticipated increases in mortgage rates.
Lennar Technical Analysis: $76.72 Is the Immediate Decision Level
LEN ended September 10 at $77.90 almost exactly on the $77.92 reference level shown in the chart after a break below the rising trend line and the previous support level of $79.97. What is interesting is the repeated rejections below the moving average of $85.44, which confirms that, in the short term, sellers dominate the market.
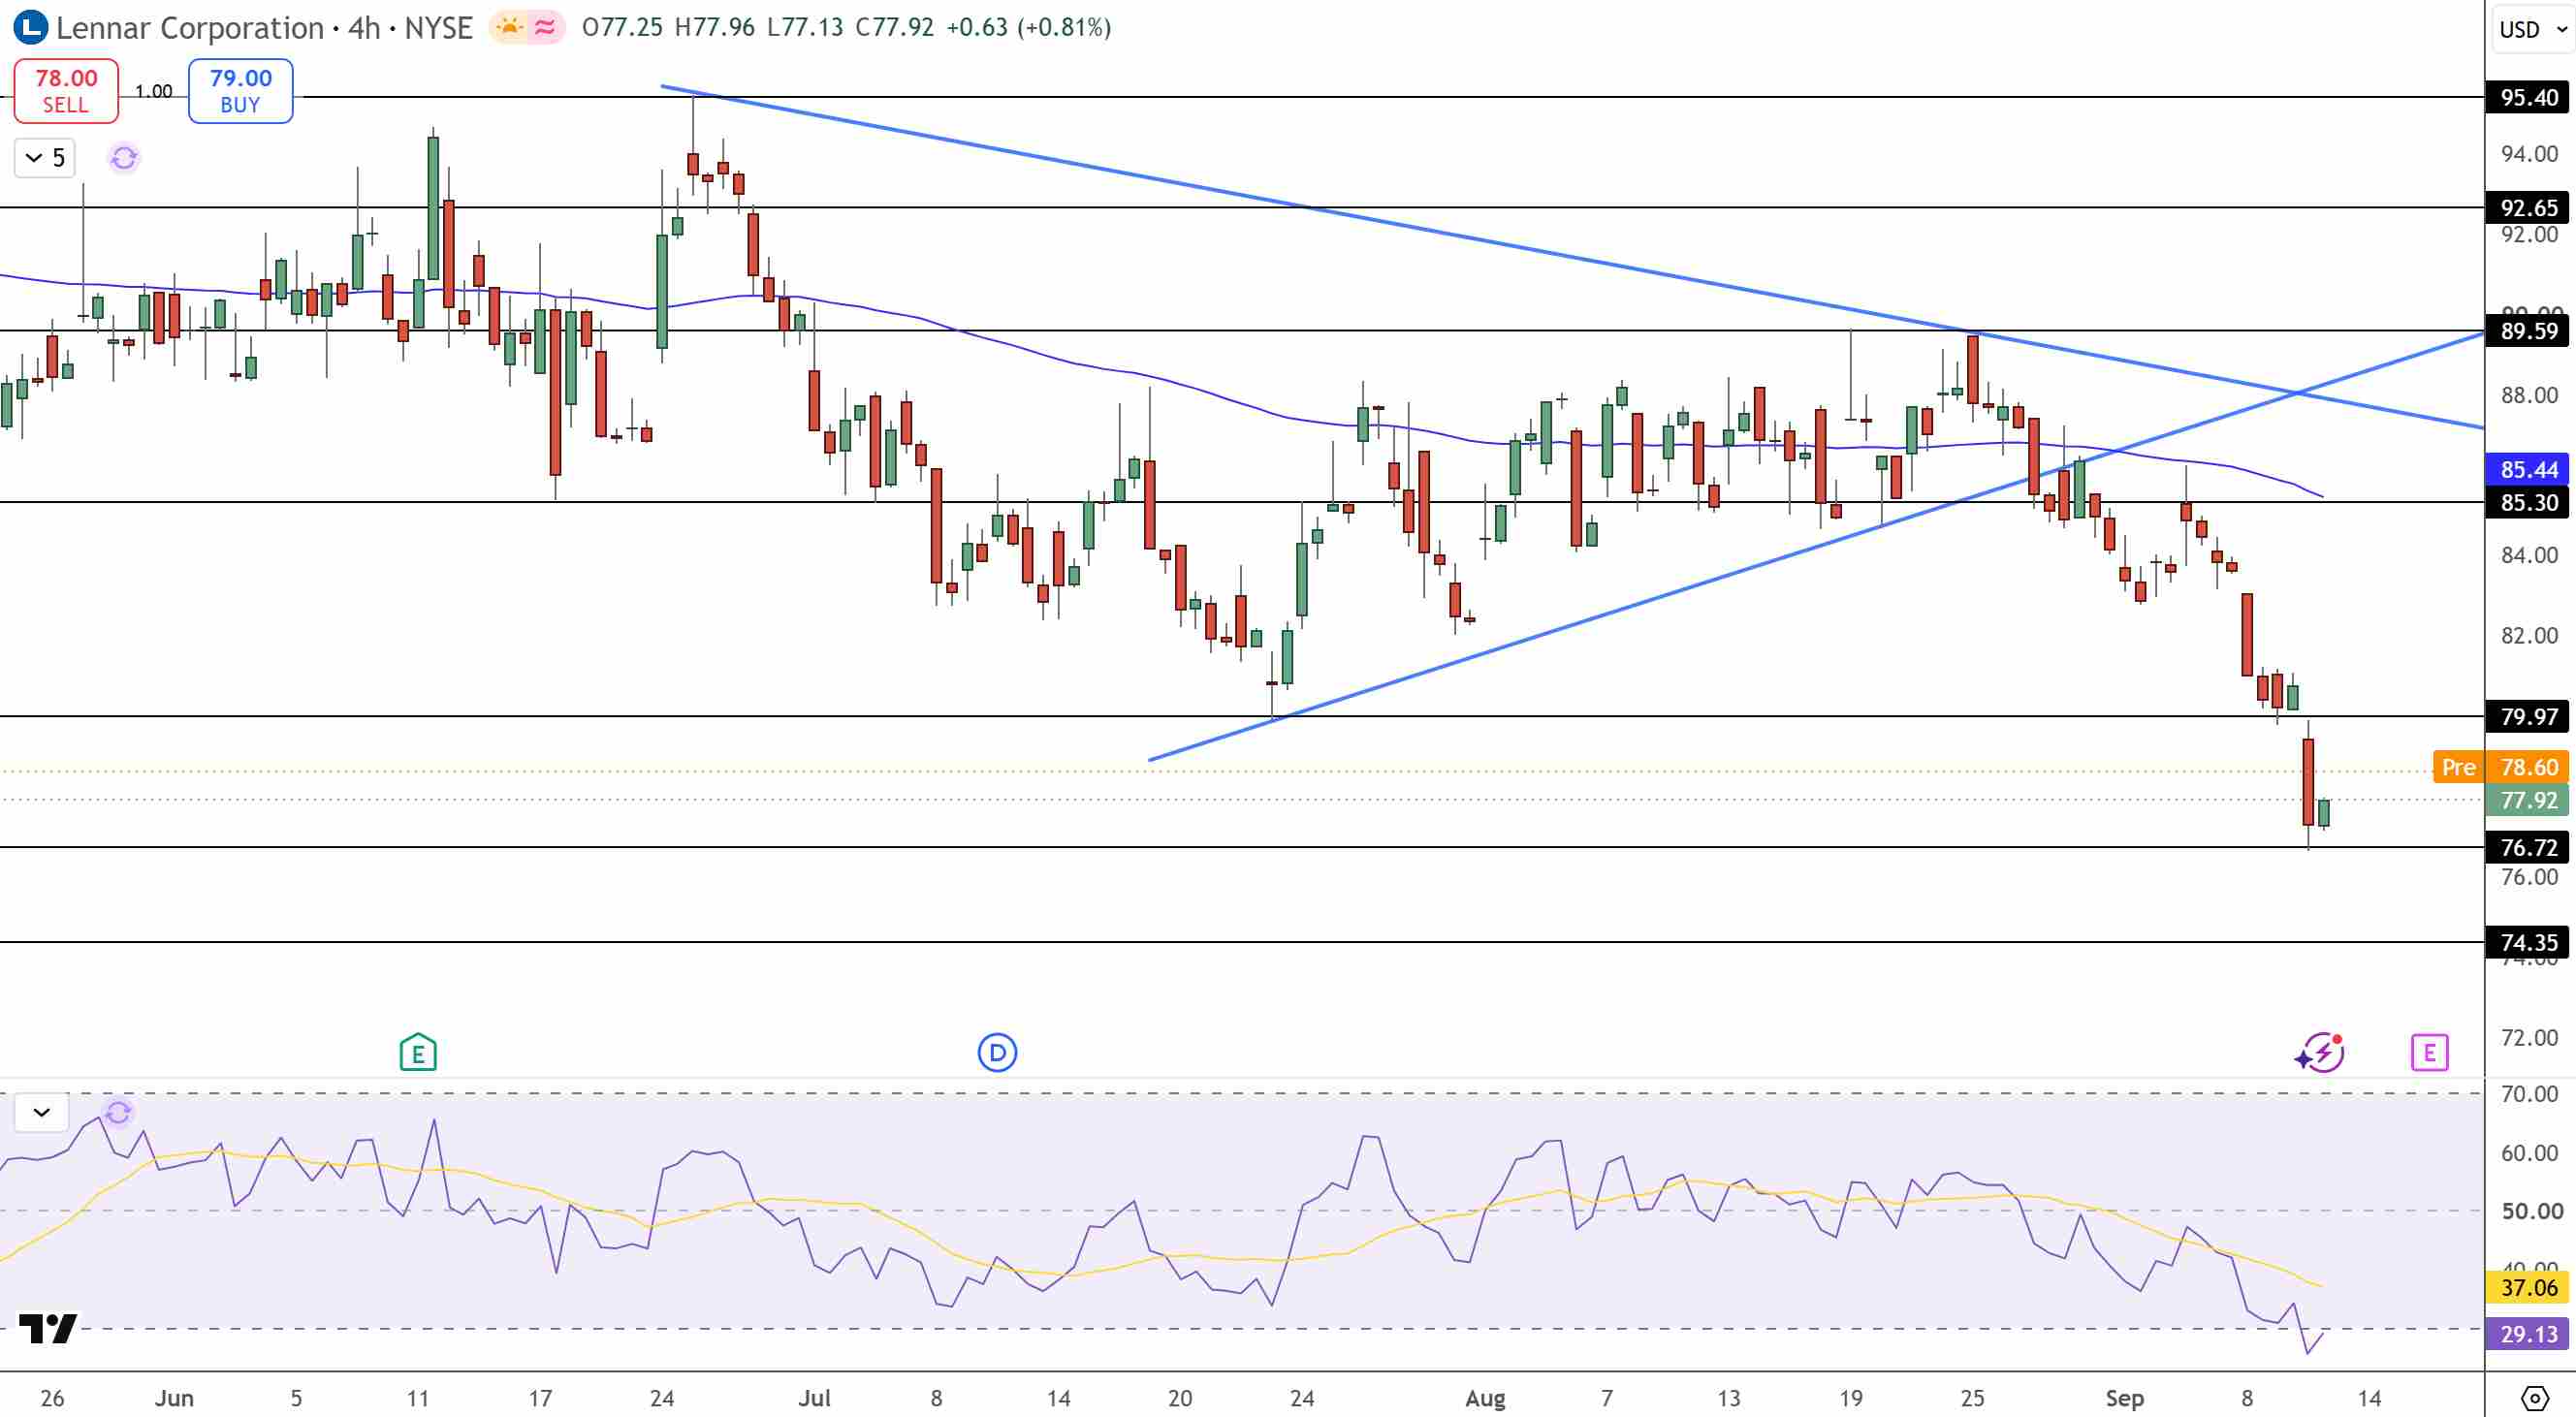
Lennar Stock Price Chart - Source: Tradingview
The support level is at $76.72, where a small rebound is attempted. If there is a 4 hour breakdown, it will extend the downtrend to $74.35, where losing the level will open the chart to a deeper selloff.
RSI at around 29 is below the oversold 30 level and the ascending signal line at 37. This could mean a short-term technical rally, but it will not negate the bearish trend.
For a meaningful recovery, LEN must go above the former support, now resistance, at $79.97. Above that, the resistance of $85.30-$85.44 takes priority.
Key Levels
· Latest completed close: $77.90
· Immediate Support: $76.72
· Bearish Target: $74.35
· First Recovery Resistance: $79.97
· Major Resistance Zone: $85.30-$85.44
· RSI: Around 29
Why is Lennar stock in focus now?
As Lennar heads into September 16 earnings, mortgage rates are rising again and the stock is trading below book value. The company is improving its execution with lower incentives, falling construction costs, faster cycles and a more healthy balance sheet, but the general economy is moving against them.
What level confirms a LEN recovery?
A recovery above $79.97 is a good start. Healing the bear trend would require a stronger recovery in the range of $85.30-$85.44.
Bottom Line
The September 11 setup for Lennar shows an improving company execution process, but the deteriorating housing execution process has the upper hand. Decreased construction costs, shortened construction cycle, strong cash-light balance sheet, and aggressive buybacks are company positives. The affordability issue is counter to all of the positives mentioned. The surge in mortgage rates only days before the Q3 earnings release make it a worse backdrop for Lennar. I have a bullish bias above $79.97, and a bearish bias below $76.72, which could open a selling opportunity for a new low at $74.35. A bearish RSI could cause a sell off, but I won't consider it a sell until $76.72 is breached.
Find out more